Your agent asked a question. Which part was slow?

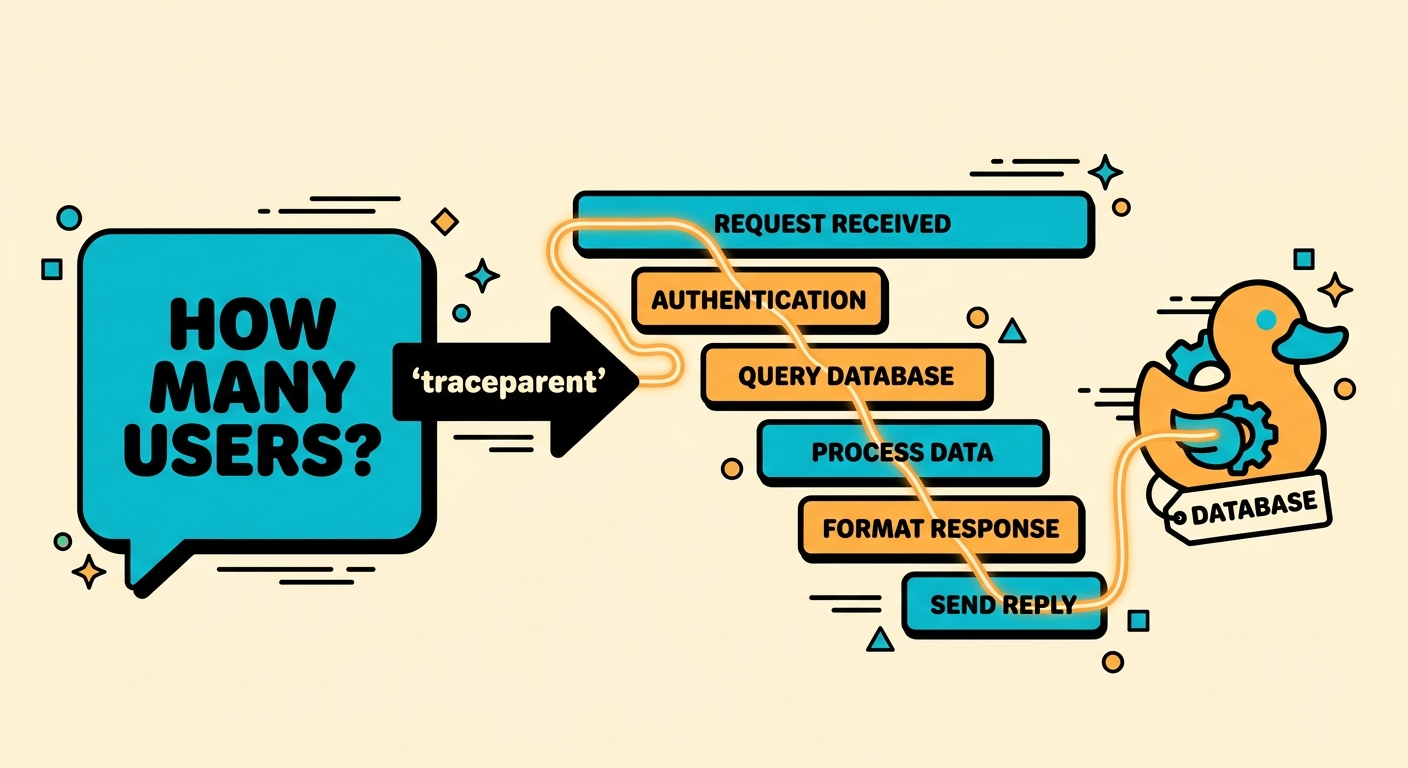
An agent asks your data API a question. Three seconds later it answers. Someone asks why three seconds, and the honest response is a shrug — because the only thing anybody can see is that a tools/call went in and JSON came out. Was it the template? The database? A JWKS refresh nobody remembers configuring? A second query you didn't know existed?
You can put a service mesh in front of flAPI and it will tell you the request took three seconds. It cannot tell you which part. Only flAPI knows that, and until now it wasn't saying.
It is now. flAPI emits OpenTelemetry traces for every request on every route, adopts the trace context an MCP agent sends alongside its tool call, and reports what DuckDB actually did underneath. All of it is off by default, and when you turn it on it exports no customer data unless you explicitly opt an endpoint in.
Let's start with the part that makes agent traffic different.
The trace an agent already has
When an AI agent calls a tool, it is usually in the middle of something larger — a chain, a retrieval step, a user's conversation. That work is very likely already traced. The agent has a trace id, and it would very much like your tool call to appear inside it rather than as a disconnected fragment somewhere else.
MCP revision 2026-07-28 made that possible, through SEP-414: the keys traceparent, tracestate and baggage are reserved — unprefixed — inside params._meta. An agent that is tracing itself puts its context there.
flAPI parses params._meta. It has for a while. What it did with those three keys until now was throw them away.
So the first thing that changed is small and not optional: flAPI reads them.
{
  "jsonrpc": "2.0",
  "method": "tools/call",
  "params": {
    "name": "northwind_customers",
    "arguments": { "country": "Germany" },
    "_meta": {
      "traceparent": "00-4bf92f3577b34da6a3ce929d0e0e4736-00f067aa0ba902b7-01"
    }
  }
}
Here is the span flAPI exported for exactly that call — real output, not an illustration:
tools/call northwind_customers     kind=SERVER   5.38ms
  trace  = 4bf92f3577b34da6a3ce929d0e0e4736
  parent = 00f067aa0ba902b7
  gen_ai.tool.name          = northwind_customers
  gen_ai.operation.name     = execute_tool
  mcp.method.name           = tools/call
  flapi.trace.context_source = meta
That trace id is the agent's. That parent span id is the agent's. flAPI did not start a new trace next to the agent's — it joined the one already in flight. Open the agent's trace in Jaeger and the database query is in there, underneath the tool call, where it belongs.
When the header and _meta disagree
If the HTTP request also carries a traceparent header, flAPI prefers the one in _meta, and records that it did so as flapi.trace.context_source = meta_over_header.
That preference is deliberate and it is worth a sentence. Behind a gateway, the HTTP hop carries the gateway's span — a real thing, but not the thing you are trying to follow. The _meta block carries the agent's. When they disagree, the agent's is almost always the trace a human is staring at while asking why something was slow.
One more property that costs nothing and pays off immediately: _meta is parsed even when tracing is switched off. The ids still reach the audit log and the application log, so correlation works before you have a collector anywhere near production.
One span per request — including the requests that never arrive
The span is created in flAPI's first middleware, not in the request handler. That sounds like an implementation footnote and it is actually the whole point.
Instrument the handler and you see the requests that succeeded. You do not see the 401, the 403, the 429, the CORS preflight, or the 404 — which is to say, you do not see any of the requests somebody is likely to be complaining about. Those never reach a handler.
So flAPI produces exactly one SERVER span for every request on every route, whatever happens to it:
| Situation | Span? |
|---|---|
| Successful REST call | Yes |
| Rejected by auth (401/403) | Yes |
| Rate limited (429) | Yes |
| CORS preflight | Yes |
| Unmatched path (404) | Yes |
| Health probe | No — excluded by default |
Health probes are excluded on purpose. In Kubernetes they are the highest-volume route in the deployment and of almost no diagnostic value once they are green.
Route labels stay bounded
http.route is always a route template or a fixed literal — never the filled path. Every unmatched path collapses into a single <unmatched> bucket.
A vulnerability scanner walking a thousand random URLs therefore produces one route label, not a thousand. That is a cardinality control, a cost control, and — since a filled path on a data API is a filter over customer data — a privacy control, all in the same decision. Caller-supplied MCP method and tool names get the same treatment: they are checked against the configured set before they are allowed anywhere near a span name.
What the trace actually shows you
Here is a real REST request against the Northwind example that ships in the repo — GET /northwind/customers/?country=Germany. Four spans, nothing invented:
GET /northwind/customers/        SERVER   6.04ms
├── flapi.render_template        INTERNAL 0.16ms
├── duckdb.query                 CLIENT   3.50ms   11 rows
└── duckdb.query                 CLIENT   1.77ms    1 row
Read that bottom-up and there is a small surprise in it.
Template rendering — the part people assume is slow because it is "string processing" — is 0.16ms, under 3% of the request. The database is 5.27ms of 6.04ms. Fine, expected.
But there are two database spans, and you only wrote one query. The second one returns a single row and takes 1.77ms — a third of the total database time. That is the pagination count query, which flAPI issues so it can tell the caller how many rows exist in total. It is doing exactly what it was asked to do. It is also invisible in every other tool you own, and it costs a third of your database time on this endpoint.
That is the kind of thing a trace is for: not a number you already suspected, but a line item you forgot you were paying for.
What DuckDB actually did
The spans above tell you the database took 5.27ms. The obvious next question is why, and EXPLAIN ANALYZE is not something you can run on a request that already happened.
So flAPI can attach DuckDB's own execution metrics — the numbers behind EXPLAIN ANALYZE, read through its C API rather than scraped from text — to the database span:
tracing:
  db_profiling: summary     # off (default) | summary | detailed
From the same Northwind call:
duckdb.query                              3.50ms
  db.operation.name              = SELECT
  db.response.returned_rows      = 11
  flapi.db.latency_ms            = 3.137278
  flapi.db.blocked_thread_time_ms = 0.0
  flapi.db.result_set_bytes      = 1936
  flapi.db.bytes_read            = 0
latency_ms is DuckDB's own measurement of the query, distinct from the span duration that wraps it — the gap between 3.50 and 3.14 is flAPI's own overhead around the call, which is a useful number to be able to see rather than assume. blocked_thread_time_ms at zero says this query never waited on anything. bytes_read at zero says it came from memory, not storage.
detailed adds cpu_time_ms and rows_scanned.
Both tiers cost the same. Measured on a trivial query, interleaved across configurations so machine drift hit each equally: off 253 µs, summary 359 µs, detailed 336 µs for the database span. detailed measuring lower than summary is not a saving — it is the difference being below the measurement's own noise. Choose a tier by what you want to see, never to save time.
Almost all of that ~100 µs is switching profiling on, not measuring: DuckDB's profiling settings are per-connection, and flAPI opens a connection per query. The overhead is fixed per query, so on a request doing real work it does not show — and on a paginated endpoint you pay it twice, once for each of those two queries. It applies only to requests that are actually sampled, so a 1% sampling ratio pays 1% of it.
It is off by default for exactly that reason.
Exporting nothing you would not want exported
A data API cannot simply switch on tracing and hope, because on a data API the interesting fields are the customer data. ?country=Germany is a filter over a customer table. The path /customers/42 names a customer.
So capture is tiered, and the default tier exports structure without values.
| Tier | Exports | Never exports |
|---|---|---|
off | nothing — no provider is even constructed | — |
metadata (default) | span structure and timings, route templates, method and status, tool names, the SQL verb, rows returned, byte counts | argument values, result rows, filled paths, query strings, credentials |
payload | metadata plus the values of declared request fields | credentials, headers, filled paths, query strings — at every tier |
Four properties are enforced by tests rather than asserted in a README:
- A global
capture: offbeats any per-endpoint opt-in. One lever is guaranteed to stop export, which is the first thing a security review asks for. - Credential-shaped keys are redacted at every tier, whatever your configuration says.
- Filled paths and query strings are never exported, at any tier.
- The payload tier genuinely captures. Without a test asserting a declared parameter value does appear, the three exclusions above would pass trivially by exporting nothing at all.
That fourth one matters more than it looks. Negative security tests are easy to write and easy to get wrong: a test that asserts a secret is absent passes beautifully against a system that exports nothing whatsoever.
Redaction uses two lists, matched differently on purpose. Your audit.redact entries match the whole key — tax_id redacts tax_id and Tax-Id, but not customer_tax_id, because you chose those names deliberately. The built-in credential list matches as a substring, so api_key, x-api-key, user_api_key and auth_token are all caught whether or not you thought of them. You configure the list once and it serves both the audit log and the trace, so the two cannot drift apart.
And error status is always an enumerated error.type — never an exception message. A stringified database exception is the single most reliable way to get a row value into a trace.
One id, three places
Underneath all of this is a single request identity, which is the part that makes the other pieces useful together.
Every response carries X-Request-Id, and the same id appears in the audit log and in every application log line emitted while serving that request. When a trace exists, trace_id and span_id join them too.
{"timestamp":"2026-05-17T05:32:11Z","request_id":"req-9f2c1a7b8e4d5063","trace_id":"4bf92f3577b34da6a3ce929d0e0e4736","principal":"alice","method":"POST","target":"/northwind/customers/","status":"success","row_count":11,"latency_ms":6}
A support ticket quoting one header is now enough to find the request, the trace, the audit entry and the log lines. The id is always server-minted — an inbound X-Request-Id is never honoured, so a caller cannot pick their own or collide with somebody else's.
Two consequences worth knowing:
- The audit log now covers REST as well as MCP, including requests rejected before the handler. A 401 and a 429 each produce a line — silence on exactly the events a reviewer is looking for would be the worst possible default.
- All of it — the request id, the log correlation, the REST audit coverage — works in a build compiled with
FLAPI_WITH_TRACING=OFF. They are not tracing features.
Turning it on
Four lines:
tracing:
  enabled: true
  exporter: otlp_http
  endpoint: http://localhost:4318
Everything else has a working default. A few things are worth knowing before production:
Kubernetes. Point it at your collector and set service.instance.id from the pod name via resource_attributes. One caveat: the OTel Operator's injected OTEL_* environment variables are mostly not read — sampler, service name, resource attributes and exporter selection all come from the tracing: block. Set them there explicitly rather than assuming injection works.
Serverless. With CPU allocated only during request processing, the instance is throttled after the response is sent, so a background export thread may never be scheduled. Allocate CPU always. flush.mode: on_response is not a workaround here — it is honoured only with the file exporter, and with an OTLP/HTTP collector flAPI warns and falls back to batch. Flushing a network export on the request thread would couple your p99 to the collector's availability, so it is refused rather than quietly supported.
Air-gapped. exporter: otlp_file writes OTLP-JSON to disk and opens no outbound connection at all.
Checking it works. GET /api/v1/_config/metrics reports spans_exported and spans_dropped, so "is anything arriving?" has an answer that is not "squint at Jaeger".
One deliberate divergence from the usual OTel behaviour: an OTEL_EXPORTER_OTLP_ENDPOINT in the environment does not by itself enable tracing. A platform-wide environment variable is not an operator's consent to ship data off the machine, so tracing.enabled is still required. OTEL_SDK_DISABLED=true always wins.
Why this was worth doing
flAPI's whole proposition is that one SQL template becomes a REST endpoint and an MCP tool at the same time. That works right up until something is slow, at which point you have two protocols, a template engine, a connection pool and an embedded database between the question and the answer — and no way to tell them apart.
The traces close that gap. The _meta support closes a different one: agent traffic is the half of the workload that is hardest to reason about, because the caller is a model and the question was generated rather than written. Being inside the agent's trace rather than beside it is the difference between debugging a system and guessing about one.
Full configuration reference, the capture tiers in detail, and the deployment notes are in Observability and Tracing.
If you turn it on and find a line item you did not know you were paying for, we would like to hear about it.